
Royalty-Free Stock Photo
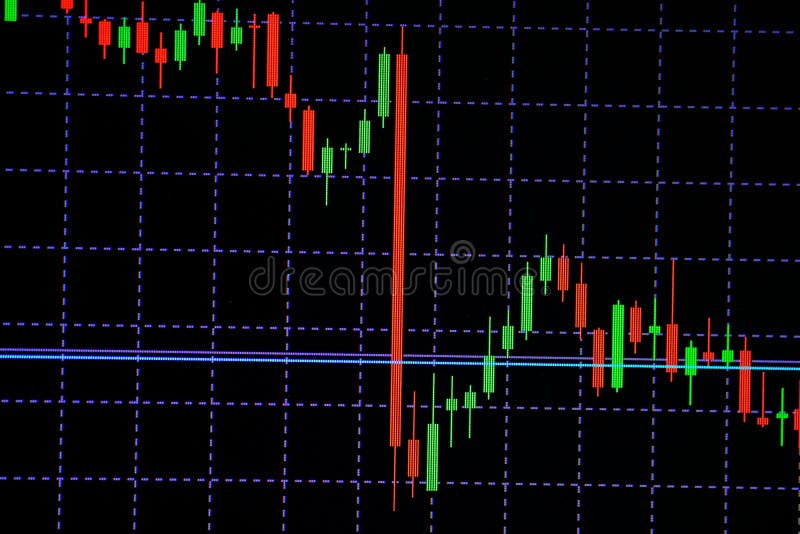
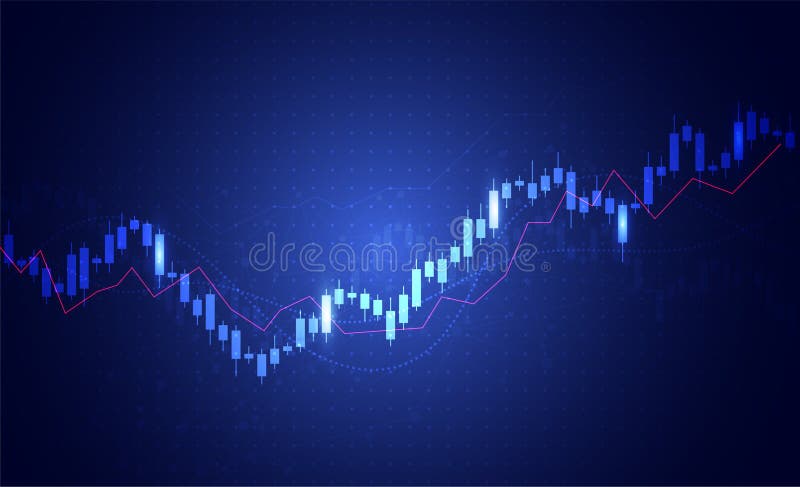
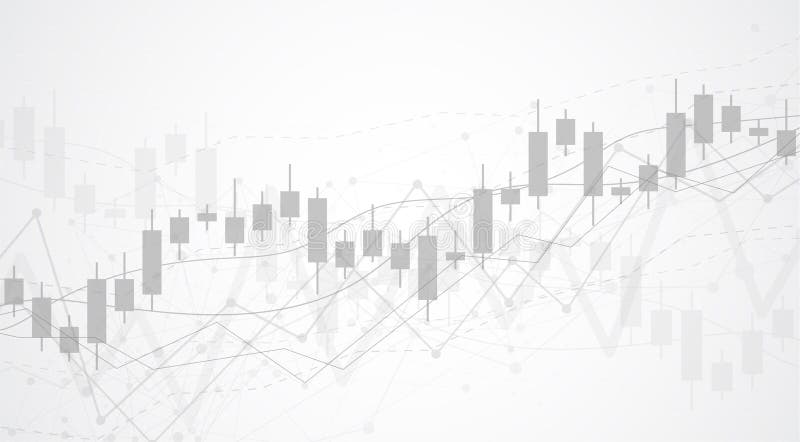
Candle stick graph chart with indicator showing bullish point or bearish point, up trend or down trend of price of stock market or stock exchange trading, investment and financial concept. thin focus.
- ?
$62.50USD
$150.00USD
$250.00USD
Size MAX
6000x4000px •
20" x 13.3" • @300dpi •
10.1MB • jpg
Author credit line

Image keywords
More similar stock illustrations


More stock photos from Thatsaphon Saengnarongrat's portfolio


